|
Call for data: We are currently seeking collaborators that have and are willing to contribute data for analysis of temporal activity patterns of bats from anywhere in the Neotropics, preferably frugivorous phyllostomids. All contributors of data would be co-authors on all resulting manuscripts. If we are able to acquire data sets from enough sites that are sufficiently distributed throughout Central and South America, we would like to address 2 sets of questions: 1) do species exhibit geographic variation in activity patterns? is geographic variation in activity associated with variation in particular abiotic variables? or with changes in habitat types? 2) Species richness (and diversity) of particular guilds varies in geographic space and species that are members of the same guild are the most likely experience interspecific competition. Does temporal overlap among all species in the same guild change in response to the number of potential competitors? Data must have time of capture for each individual with nets checked at least once an hour. Larger sample sizes are better as they provide more accurate estimates of activity patterns. We currently have data from:
For more information or to become a collaborator please contact Steve Presley |
Another call for data: Similar to the case for bats, we are seeking collaborators for the analysis of temporal activity patterns of non-volant small mammals (e.g., rodents, marsupials, insectivores). Historically, few researchers have collected the necessary data to evaluate temporal activity for small mammals; however, with the advent of new technologies (thermal video recording, PIT tagging, video monitoring, etc.) the activity patterns of animals may be recorded while collecting data for other purposes. We are seeking activity data from small mammal assemblages that have 3 or more species from anywhere in the world. All contributors of data would be co-authors on the resulting manuscripts. If enough data is gathered it may be possible to address several questions, including: 1) What is the prevalence of temporal niche partitioning among coexisting species of small mammal? 2) What is the relationship between species richness and degree of temporal niche partitioning in among species of small mammal? 3) Is temporal activity a species characteristic or do species change their times of activity based on species composition of local assemblages (i.e. are measured activity patterns representative of fundamental or realized niche space)? Data could have been collected by different means but as long as it can be assigned to 1 or 2 hr time blocks it would be useful for this type of analysis. Larger sample sizes are better able to characterize activity patterns; therefore, activity patterns based on at least 30 individuals are more reliable and more confidently included in analyses. For more information please contact Ivan Castro-Arellano. |
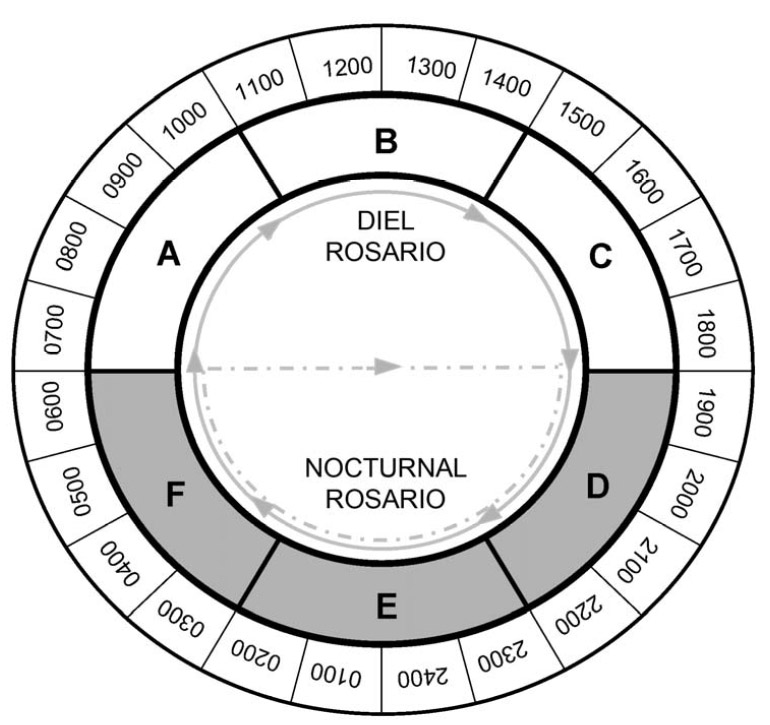
Temporal activity patterns indicate how species exploit the environment and generally are considered to represent an important niche dimension (Pianka 1973). Indeed, the time of activity often has an evolutionary basis, with species exhibiting phylogenetic constraints on the times during which they are active (Roll et al. 2006). Nonetheless, compared to other niche axes (e.g., habitat, diet), partitioning of time among species rarely is studied. Species that occupy the same habitat and feed on similar resources may reduce competition (or exhibit exploitative competition) by being active at different times. Such interactions may lead to less temporal overlap than expected by chance. Alternatively, if competition is not important, temporal patterns of activity of ecologically similar species may be molded by shared responses to common external factors (e.g., ambient temperature, predator avoidance), which may result in more temporal overlap than expected by chance. Ivan Castro-Arellano and Michael Willig led the development of an null model approach to evaluate patterns of temporal niche overlap (Castro-Arellano et al. submitted). The resultant algorithm (Rosario) was designed specifically for use with data that are inherently ordered and cyclical in nature such that progressions return to the same point as in time of day, annual seasons, or El Niño cycles. Rosario maintains the shape of the empirical distribution of activity (i.e., temporal autocorrelation) of each species by shifting entire activity patterns a random number of intervals to create randomly generated amounts of niche (temporal) overlap. Alternative null models that evaluate niche overlap (e.g., randomization algorithm 3, randomization algorithm 4; Winemiller and Pianka, 1990) were designed for nominal data (e.g., categories of prey or microhabitat). These approaches create null spaces that are unrealistically large for naturally ordered data and result in a liberal test of the null hypothesis. |
||||||||
The TimeOverlap Program |
||||||||
TimeOverlap is a software program written by Thiago F. Rangel that uses a simulation approach to evaluate the amount of overlap among a number of distributions. It was developed to evaluate temporal niche overlap, but could be applied to a number of scenarios that involve interval or ranked data. The program represents a species-based approach; as such the program employs a randomization algorithm (Rosario) that performs random shifts of entire distributions (i.e., in contrast to other simulation approaches Rosario preserves much of the temporal autocorrelation inherent in activity patterns) within the time frame of analyses. For each randomization, the program calculates the amount of overlap of each group of randomized distributions for each iteration, and significance is determined by comparison of randomized overlap values to the amount of empirical overlap. TimeOverlap uses the Pianka (1973) and Czechanowski (Feinsinger et al. 1981) indices to estimate overlap. In general, results using either metric are congruent. The basis for the simulations is a species by time-use matrix in which species are arranged in rows, and time intervals are arranged chronologically in columns. TimeOverlap only uses text tab-delimited files with no headings for columns or rows. Empirical data must be specified in proportional abundances (0 to 100) and totals for each species should be the same (100%). Failure to scale data so that row totals equal 100 will result in erroneous calculations of the Czechanowski index, but will not affect associated levels of significance. Input files must be in the same folder as the TimeOverlap.exe file and output files will be created within this folder. The output from the program consists of two parts: a summary of results that can be pasted directly into text based program (this summary is automatically copied to the clipboard), and detailed results that are saved into a user specified file. This file will contain the overlap values for each of the overlap indices for each iteration of the simulation. How to use TimeOverlap. Double click on the TimeOverlap.exe icon to open the program. A window will appear prompting the user to specify 3 things: (1) Name of the input data file (.txt); After inputting this information, click the Run! button. A new window will appear with the results summary and the specified output data file will be created. The summary of results will look like this: Time Overlap Null Model Finished! Observed Pianka Index: 0.287462243523439 Pianka: Randomizations less than observed: 2 Czechanowski: Randomizations less than observed: 1 Analytical results copied to the clipboard (Use MS Word to paste)
If an a priori expectation exists that temporal overlap should be greater than expected by chance(coincident activities), then a one-tailed test is conducted and the p-value is calculated as the proportion of randomizations that have an overlap that is equal to or greater that the empirical overlap value (observed). Alternatively, if there is an a priori expectation that temporal overlap should be less than expected by chance (segregated activities), then a one-tailed test is conducted and the p-value is calculated as the proportion of randomizations that resulted in overlap that is equal to or less than the empirical overlap value (observed). In the absence of an a priori directional expectation, a two-tailed test is conducted. To determine the p-value, one must double the lower of two values: (1) the proportion of randomizations that resulted in overlap that was equal to or less than the empirical value, or (2)the proportion of randomizations that resulted in overlap that was equal to or greater than the empirical value. For example, in the summary of results for a one-tailed test that is appears above, the simulations indicate that the distributions overlap significantly less than expected by chance (p-value for Pianka = 0.0002; p-value for Czechanowski = 0.0001). As stated in the main paper, the results from TimeOverlap can be contrasted with those from other simulations models (RA3 & RA4) implemented by Ecosim (Gotelli and Entsminger 2004). DOWNLOADS
If you publish a paper that includes analyses which used the TimeOverlap Program, we would greatly appreciate it if you could provide a copy of those publications or an email message that includes the citation information of such papers. |
||||||||
Application of Activity Pattern Analyses |
||||||||
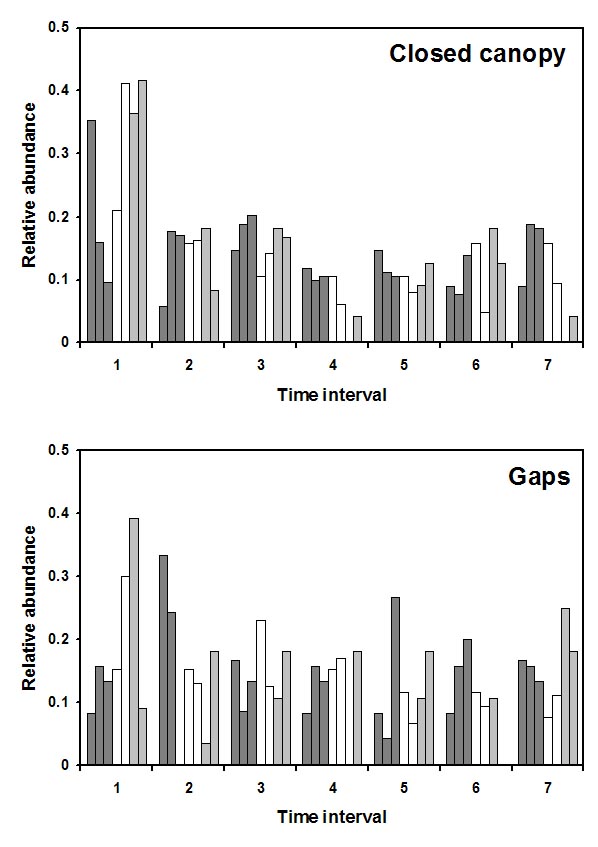
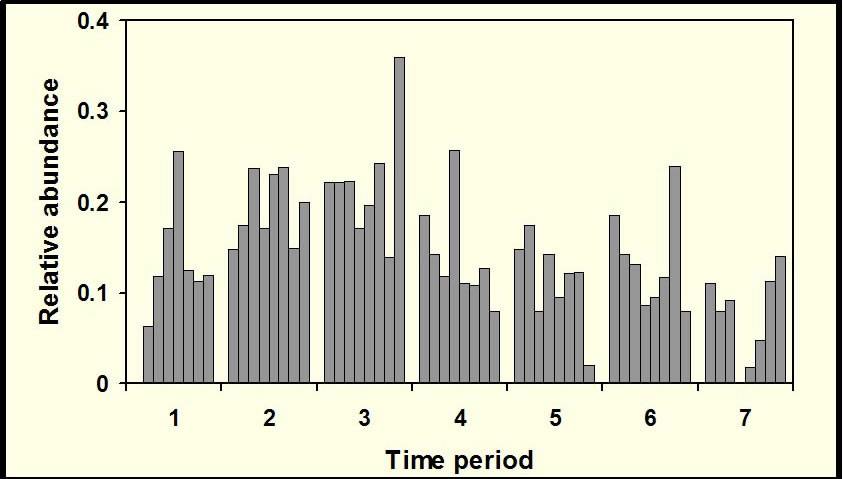
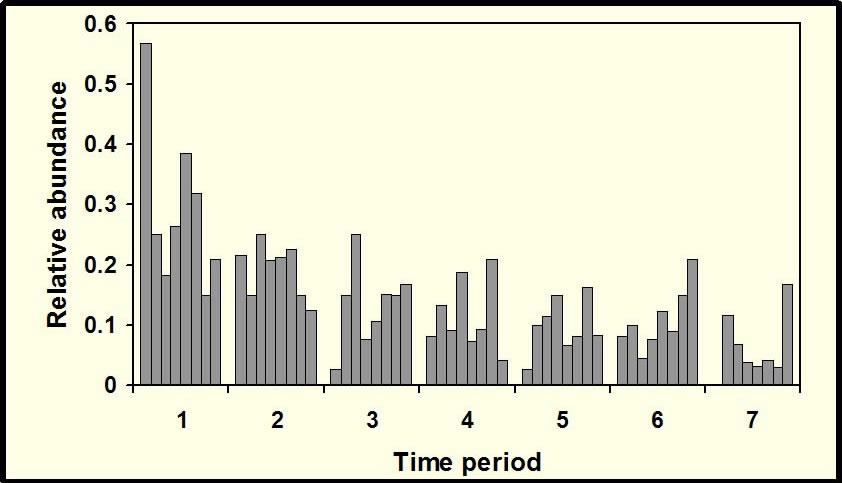
We recently used analyses of temporal activity patterns to evaluate temporal niche partitioning of social wasps that use the same resources base (cashew fruits) in northeastern Brazil. Similar to results for analyses of bats, wasps exhibited more overlap than expected by chance; however, wasps displayed bimodal patterns of activity with peaks in activity between 0900 and 1200 hours and between 1400 and 1600 hours. Although one would expect competition to be greatest among species that belong to the same functional group or guild and for temporal segregation to occur among such species to reduce competition, it may be that species within guilds generally exhibit temporal overlap as all species in the group share common responses to other factors. For example, frugivorous bats exhibit similar patterns of activity in response to predation during twilight and to meet high energy demands associated with flight. Alternatively, common responses to abiotic variables may lead to coincident patterns of activity; diurnal variation in temperature and humidity likely lead to overlap of foraging times of social wasps. Analyses of temporal activity patterns suggest that intra-guild competition may not be particularly important in structuring guilds; rather, constraints associated with being a member of a particular guild may lead to guild-mates exhibiting similar responses to the abiotic and biotic environment, with intra-guild competition of secondary importance along this niche axis. Subsequent reseach lead by Alessandra Fonseca Brito and Cândida Maria Lima Aguiar and performed in conjuction with Gilberto Marcos de Mendonça Santos from the Universidade Estadual de Feira de Santana as part of Projeto Casadinho has studied both temporal and trophic niche axis overlap in ants (Brito et al. 2012) or focused on the trophic niche axis for bees (Aguiar et al. 2012) of flower visiting insects in the Brazilian Caatingas. Flower-visiting ants exhibited dietary overlap during each season, however the composition of the ant assemplage visiting flowers differed greatly between seasons, suggesting seasonal complementarity in these highly dynamic plant-animal interactions. In contrast, resource use by bees was highly complementary, with less overlap in available floral resources than expected by chance. These studies suggest that diurnal activity patterns are not axes along which species partition niche space, whereas the trophic niche axis evinces a great deal of niche segregation.
|
||||||||
Collaborators on Activity Pattern Research
|
||||||||
Related Publications Presley, S. J., M. R. Willig, I. Castro-Arellano, and S. C. Weaver. 2009a. Effects of habitat conversion on activity patterns of phyllostomid bats in lowland Amazonian rainforest. Journal of Mammalogy 90:210-221. Presley, S. J., M. R. Willig, L. N. Saldanha, J. M. Wunderle, and I. Castro-Arellano. 2009b. Reduced-impact logging has little effect on temporal activity of frugivorous bats (Chiroptera) in lowland Amazonia.. Biotropica 41:369-378. Castro-Arellano I., S. J. Presley, M. R. Willig, J. M. Wunderle, and L. N. Saldanha. 2009. Reduced-impact logging and temporal activity of understorey bats in lowland Amazonia. Biological Conservation 142:2131-2139. Castro-Arellano, I., and T. E Lacher, Jr. 2009. Temporal niche segregation in two rodent assemblages of subtropical Mexico. Journal of Tropical Ecology 25:593-603. Castro-Arellano, I., Lacher, T. E., Jr., Willig, M. R., Rangel, T. F. 2010. Assessment of assemblage-wide temporal-niche segregation using null models. Methods in Ecology and Evolution 1:311-318. Santos, G. M. de M. and S. J. Presley. 2010. Niche overlap and temporal activity patterns of social wasps in a Brazilian cashew orchard. Sociobiology 56:121-131. Brito, A. F., S. J. Presley, and G. M. de M. Santos. 2012. Temporal and Trophic Niche Overlap in a Guild of Flower-Visiting Ants in a Seasonal Semi-Arid Tropical Environment. Journal of Arid Environmentals 87:161-167. Aguiar, C. M. L., G. M. de M.Santos, C. F. Martins, and S. J. Presley. 2013. Trophic niche breadth and niche overlap in a guild of flower-visiting bees in a Brazilian dry forest. Apidologie 44:153-162. Santos, G.M.M., W. Dáttilo, and S.J. Presley. 2014. The seasonal dynamic of ant-flower networks in a semi-arid tropical environment. Ecological Entomology DOI: 10.1111/een.12138. Carvalho, D.M., S.J. Presley, and G.M.M. Santos. 2014. Niche overlap among flower-visiting bees (Hymenoptera: Apoidea) in an agricultural system. Neotropical Entomology DOI: 10.1007/s13744-014-0239-4. Literature cited Feinsinger, P., E. E. Spears, and R. W. Poole. 1981. A simple measure of niche breadth. Ecology 62:27-32. Gotelli, N. J. and Entsminger, G. L. 2004. EcoSim: null models software for ecology. (V. 7.0). Acquired Intelligence and Kesey-Bear. Jericho, VT. Pianka, E. R. 1973. The structure of lizard communities. Annual Review of Ecology and Systematics 4:53-74. Poole, R. W. and B. J. Rathcke. 1979. Regularity, randomness, and aggregation in flowering phenologies. Science 203:470-471. Roll, U., T. Dayan, N. Kronfeld-Schor. 2006. On the role of phylogeny in determining activity patterns of rodents. Evolutionary Ecology 20, 479-490. Winemiller, K.O. and E. R. Pianka. 1990. Organization in natural assemblages of desert lizards and tropical fishes. Ecological Monographs 60, 27-55. |
||||||||
Please contact steven.presley@uconn.edu or michael.willig@uconn.edu if you have questions, comments, or corrections. Unless otherwise indicated, figures, tables, and images that appear on this page may not be used, reproduced, copied, or posted elsewhere, for any reasons, without permission. |
||||||||