Caribbean bat composition
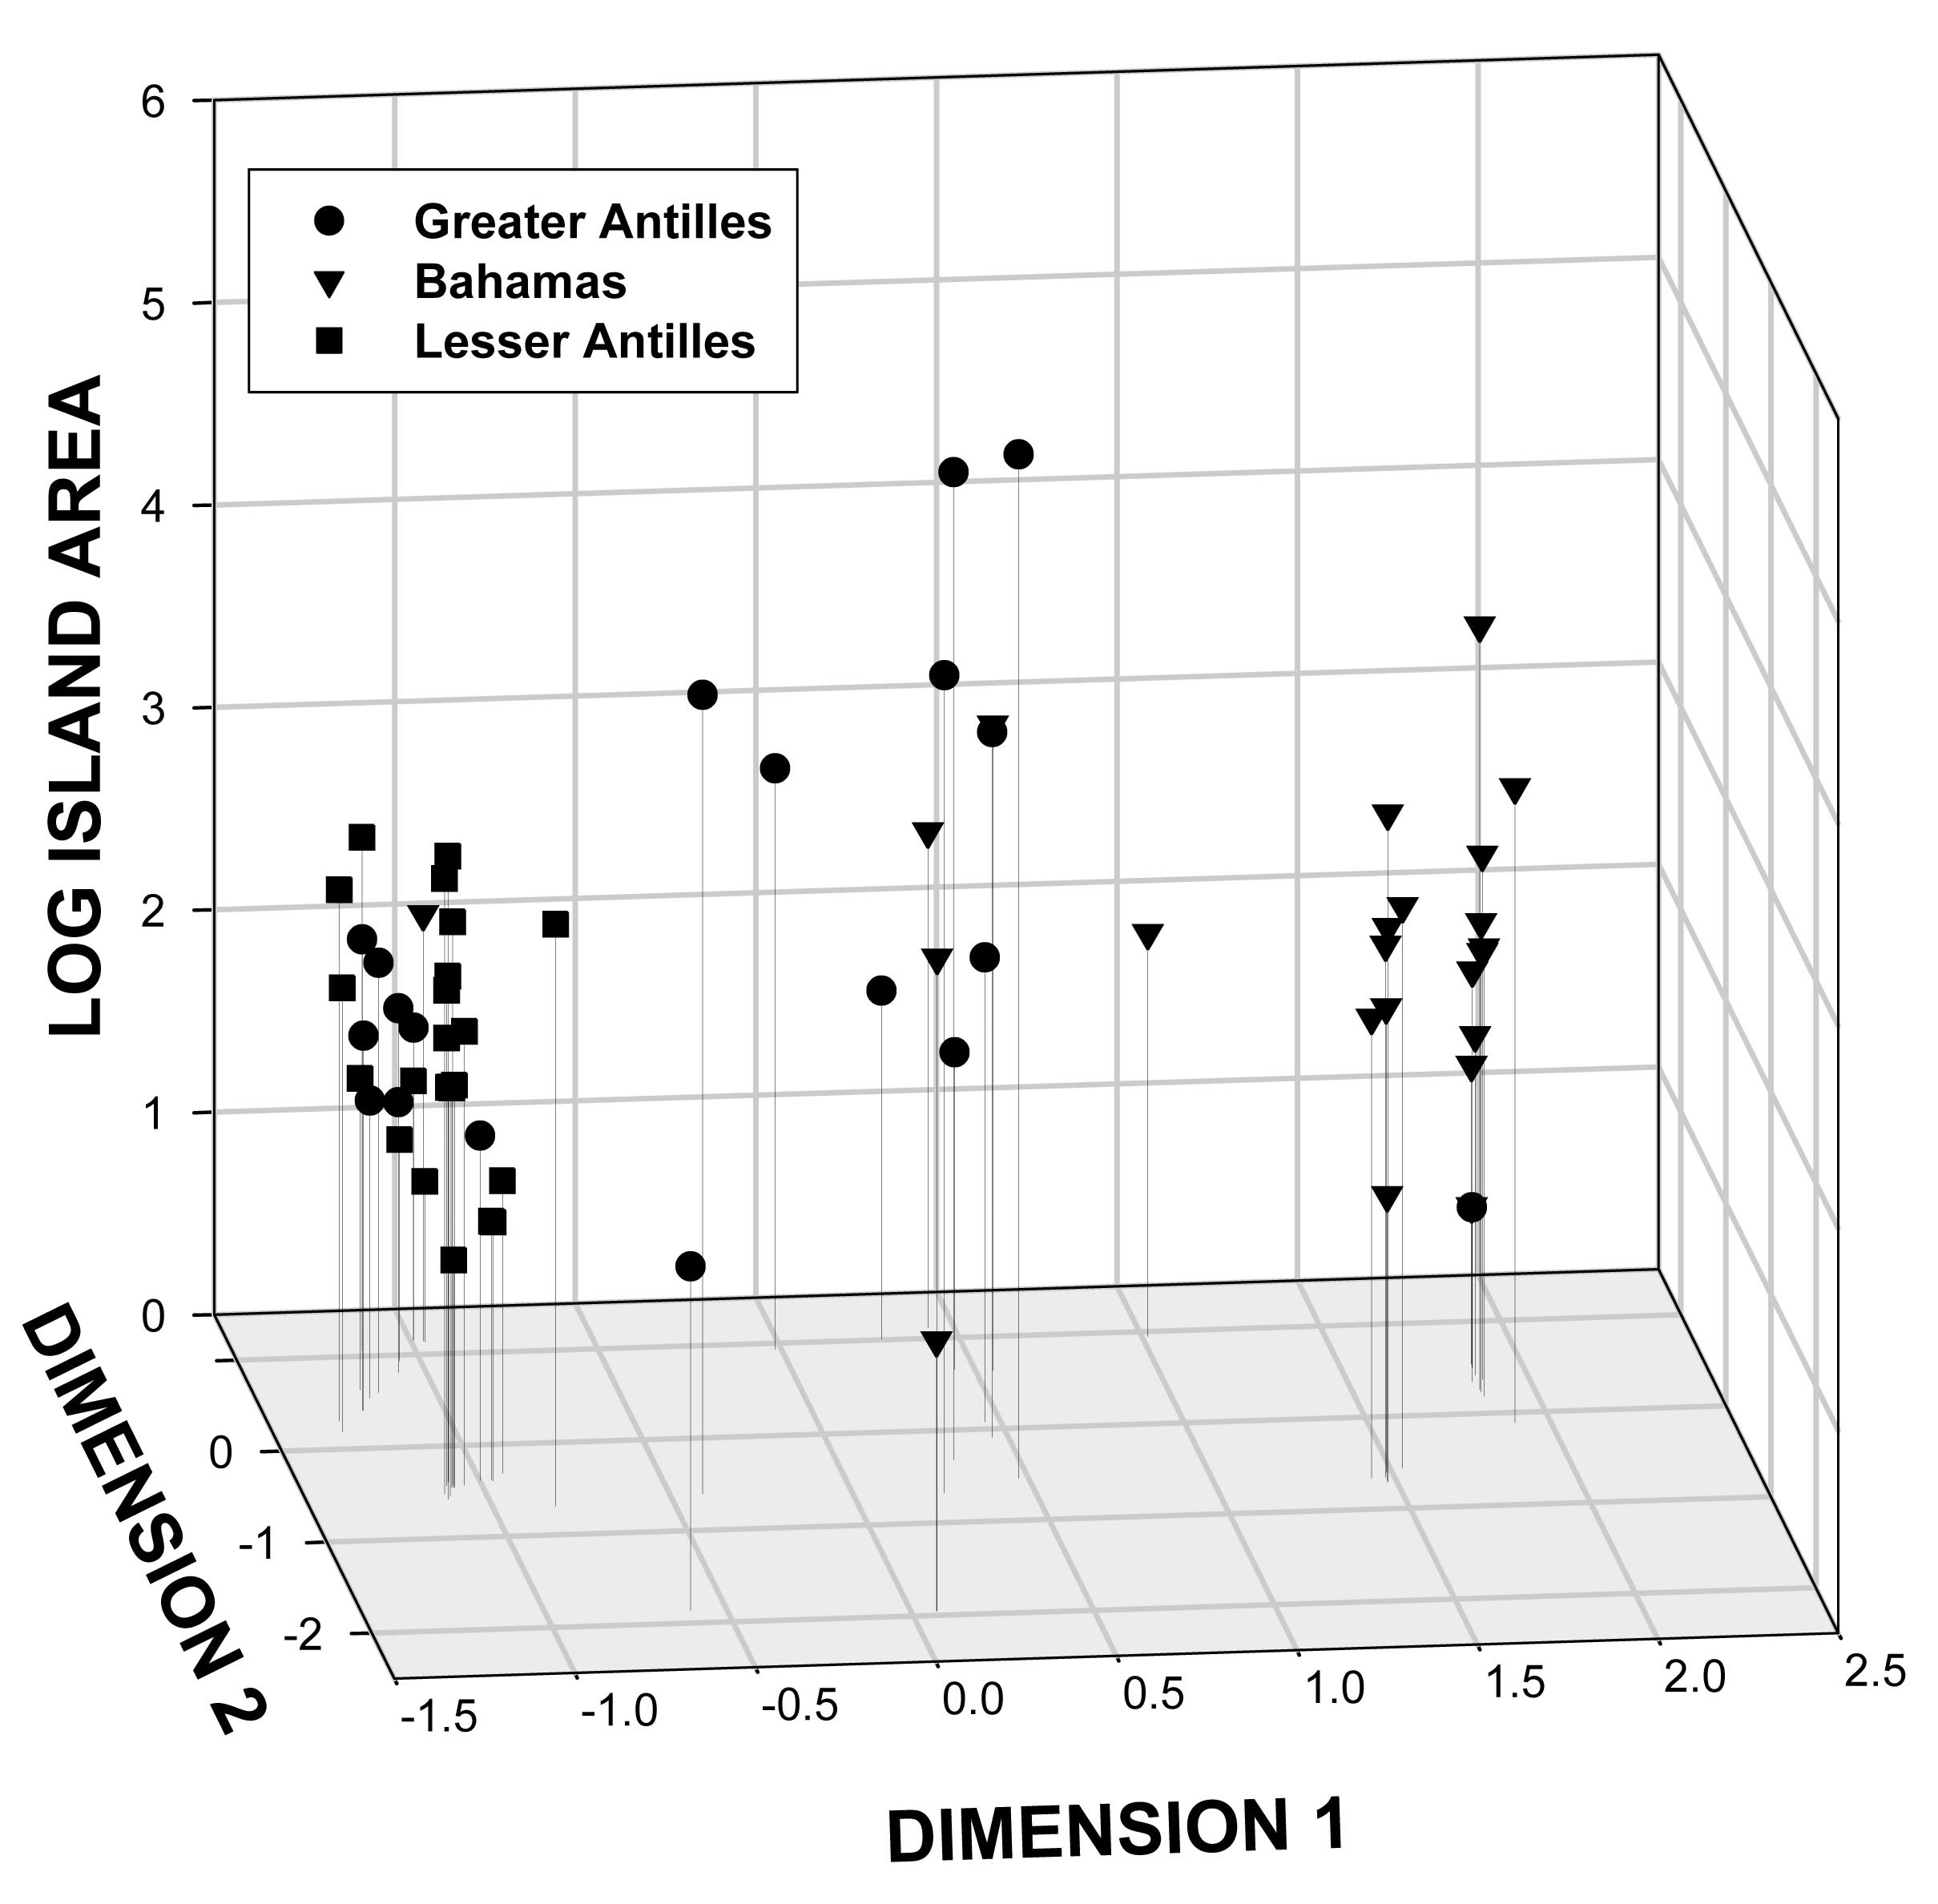 |
| Three-dimensional graph showing the unique bat species composition for each island group. Dimensions 1 and 2 are from NMDS data reduction. From Willig et al. 2009. |
|
| Three-dimensional graph showing the unique bat species composition for each island group. Dimensions 1 and 2 are from NMDS data reduction. From Willig et al. 2009. |
Please contact steven.presley@uconn.edu or michael.willig@uconn.edu if you have questions, comments, or corrections. Unless otherwise indicated, figures, tables, and images that appear on this page may not be used, reproduced, copied, or posted elsewhere, for any reasons, without permission. |